

▶ Table of Contents
- Understanding Your Website Visitors Through Analytics
- Using Heatmaps and Session Recordings to Observe User Behavior
- Leveraging User Feedback and Surveys
- Analyzing Search Data to Optimize Navigation and Content
- Personalization Using Behavioral Data
- Mobile Experience Optimization Based on Data
- Testing and Iterating Improvements
- Conclusion
User Experience (UX) refers to how visitors feel when interacting with your website—the ease of navigation, clarity of information, and overall satisfaction. For travel websites, delivering an excellent UX is vital because travelers often make complex, emotionally charged decisions involving time and money. Data-driven UX improvements mean using actual user behavior and feedback rather than assumptions to make your site more effective. This approach helps boost engagement, reduce frustration, and increase bookings. By analyzing both quantitative data (numbers and metrics) and qualitative data (user opinions and behavior), travel brands can create seamless and enjoyable online experiences.
Understanding Your Website Visitors Through Analytics
Web analytics tools collect and analyze data about your website visitors’ behavior. Metrics such as bounce rate (the percentage of visitors who leave after viewing only one page), session duration (average time spent on the site), user flow (the path visitors take through the site), and conversion rates (percentage completing desired actions) provide insights into how well your site meets user needs.
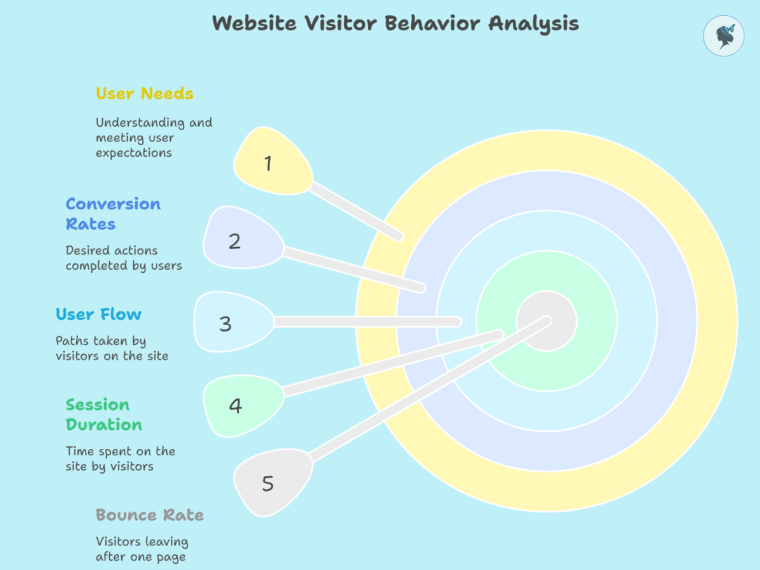
For example, a travel site noticed a high bounce rate on their booking page, indicating visitors were leaving before completing purchases. By analyzing analytics data, they identified slow loading times and confusing layout as causes, leading to a redesign that improved bookings by 20%.
Popular tools like Google Analytics and Adobe Analytics provide comprehensive dashboards to track these important metrics easily.
Adobe emphasizes that analytics help companies deliver exceptional customer experiences, personalization, and measurable business growth.
Read our post: The Importance of Personalization in Travel.
Using Heatmaps and Session Recordings to Observe User Behavior
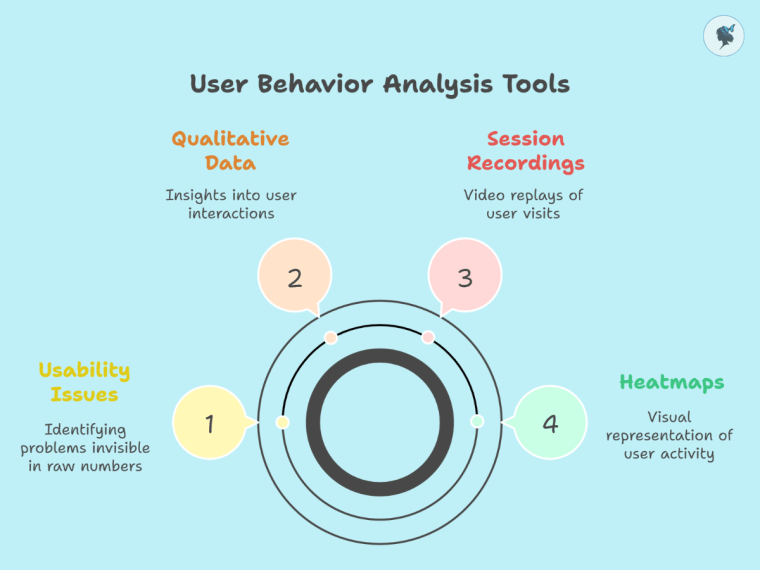
Heatmaps visually represent where users click, scroll, or hover on a page, highlighting popular or ignored areas. Session recordings are video replays of individual user visits showing mouse movements and clicks. These tools provide qualitative data, helping identify usability issues invisible in raw numbers.
For example, a travel agency discovered from heatmaps that their booking button was hidden below the fold (not visible without scrolling), causing many users to miss it. After relocating the button above the fold, conversions improved significantly.
Platforms like Hotjar, Crazy Egg, and Microsoft Clarity allow travel brands to implement heatmaps and session recordings with easy setup processes.
Step-by-step:
- Sign up for Hotjar and add the tracking code to your website.
- Enable heatmaps for your main pages (homepage, booking, destination guides).
- Review heatmap reports weekly and note patterns of clicks and scrolls.
- Use session recordings to watch user interactions and identify friction points.
78% of users say that poor website usability negatively impacts their willingness to buy.
Leveraging User Feedback and Surveys
Direct user feedback complements behavioral data by revealing visitor motivations, frustrations, and preferences. On-site surveys, exit intent surveys, and post-booking feedback forms can gather actionable insights.
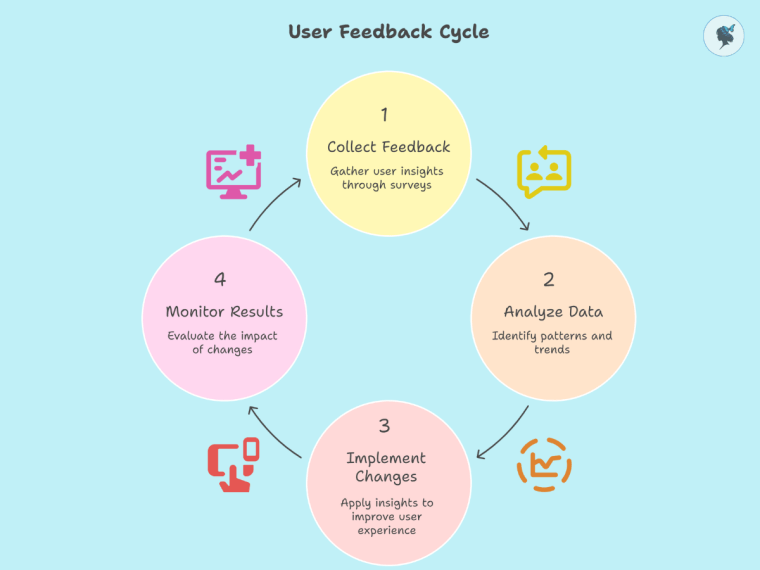
For example, a boutique travel agency used exit surveys to learn that users wanted more flexible cancellation policies. By updating their policies and highlighting this information, they reduced cart abandonment by 15%.
Survey tools such as SurveyMonkey, Qualaroo, and Google Forms make it simple to design and deploy these surveys effectively.
Step-by-step:
- Choose a survey tool like SurveyMonkey.
- Design concise surveys with specific questions (e.g., “What prevented you from completing your booking?”).
- Implement pop-up surveys triggered when users try to leave the site or after booking completion.
- Analyze responses monthly to identify trends.
Companies that collect and act on user feedback have a 10-15% higher customer retention rate.
Analyzing Search Data to Optimize Navigation and Content
Many visitors use your site’s internal search to find specific destinations, services, or information. Analyzing these queries helps identify gaps in navigation or content.
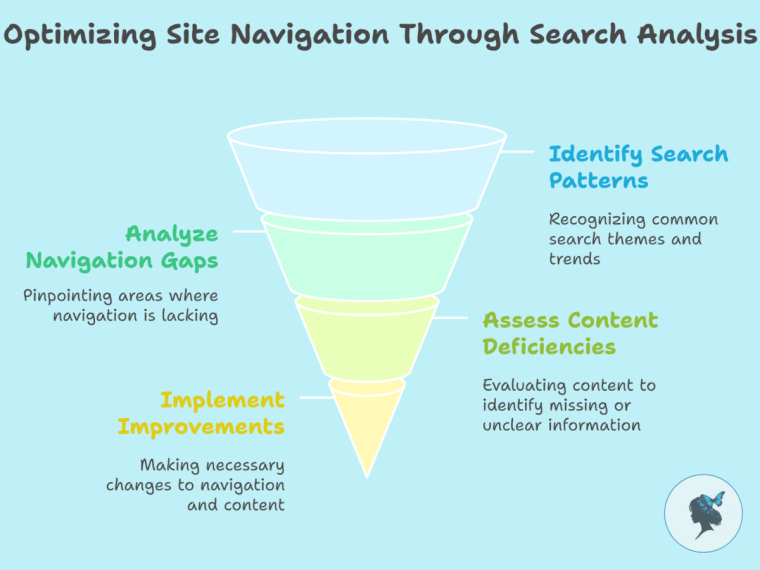
For example, a travel blog noticed many users searched for “eco-friendly tours,” which was not a featured category. They created a dedicated section for sustainable travel, increasing page views and bookings in that niche.
Tools like Google Analytics Site Search and Athos Commerce allow you to analyze these search terms and tailor your content accordingly.
43% of users rely on internal search to navigate websites, and these visitors are twice as likely to convert.
Personalization Using Behavioral Data
Personalization means tailoring content and offers based on user behavior, such as browsing history or preferences. Behavioral data helps recommend relevant destinations, deals, or experiences.
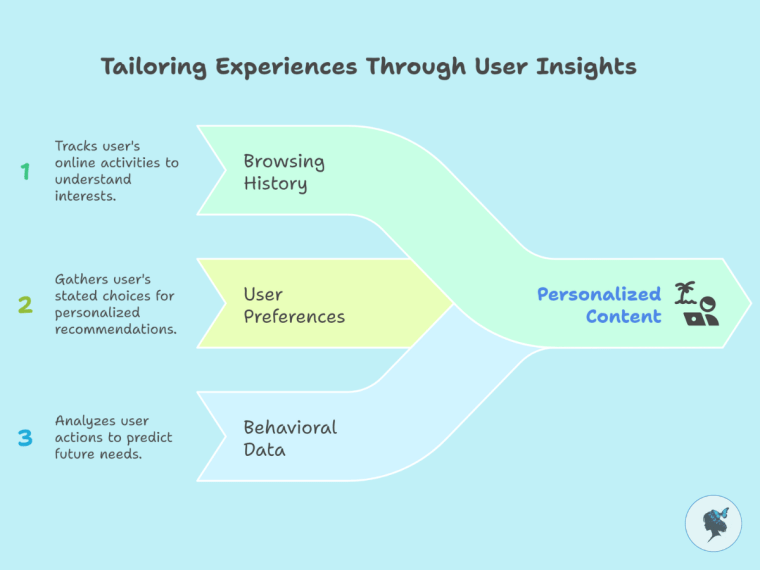
For example, a travel company detected a user browsing family-friendly resorts and dynamically displayed family package offers and child-friendly activities on the homepage, improving engagement.
Platforms like Dynamic Yield, Optimizely, and Segment provide easy-to-use personalization tools to implement targeted user experiences.
Step-by-step:
- Implement a personalization platform like Dynamic Yield.
- Define user segments (e.g., families, solo travelers).
- Set up personalized content blocks based on browsing behavior.
- Monitor performance and adjust targeting as needed.
87% of consumers are more likely to do business with travel brands offering personalization, with 61% willing to spend more for it.
Mobile Experience Optimization Based on Data
With over 60% of travel bookings made on mobile devices, optimizing mobile UX is critical. Data such as device-specific behavior, page loading times, and mobile bounce rates highlight issues.
For example, a hotel chain used Google PageSpeed Insights and BrowserStack to identify and fix slow-loading mobile booking forms, resulting in an 18% increase in mobile bookings.
Read our post: Mobile Optimization for Travel Companies
Testing and Iterating Improvements
A/B testing compares two versions of a webpage to see which performs better. Multivariate testing tests multiple variables simultaneously. Testing based on data insights helps validate improvements before full rollout.

For example, a tour operator tested two versions of a “Book Now” button (red vs. green). The green button led to a 12% higher click-through rate.
Tools like Google Optimize and Optimizely simplify setting up and running these tests.
Step-by-step:
- Choose the page element to test (e.g., CTA button).
- Create two variants differing only in that element.
- Run the test for sufficient traffic to gather statistically significant data.
- Implement the winning version.
Companies that use A/B testing see conversion rates improve by an average of 20%.
More about A/B testing here.
Conclusion
Using data to improve your travel website’s user experience is not a one-time task but an ongoing process of learning, testing, and iterating. By combining quantitative metrics, qualitative insights, user feedback, and personalization, travel brands can build websites that truly meet traveler needs, driving satisfaction and revenue. Embrace data-driven UX improvements to stay competitive and deliver exceptional travel experiences online.
Need help with your data? Contact us to see how we can help!
Discover more from Wander Women Strategies
Subscribe to get the latest posts sent to your email.

One thought on “How to Use Data to Improve Your Travel Website’s User Experience”
Comments are closed.