

▶ Table of Contents
Introduction
In today’s competitive travel industry, data-driven decisions are essential for success. Tracking the right marketing metrics helps travel brands understand what’s working, optimize campaigns, and boost bookings. However, with so many data points available, knowing which ones truly matter can be overwhelming.
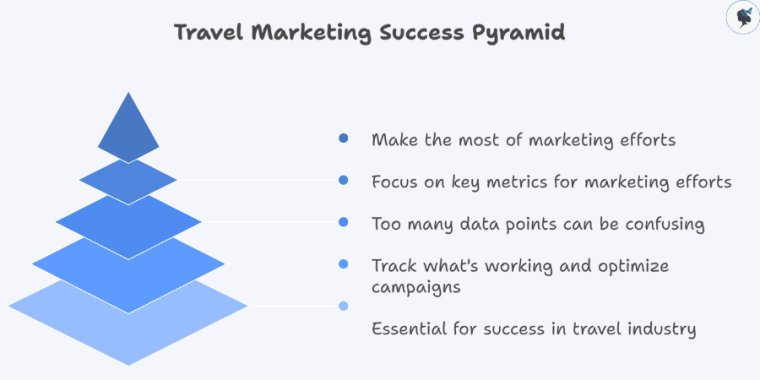
This guide breaks down the top metrics every travel marketer should track, with examples and actionable tips to help you make the most of your marketing efforts.
Website Traffic Metrics
Tracking your website’s traffic provides a clear picture of your brand’s online visibility and user engagement.
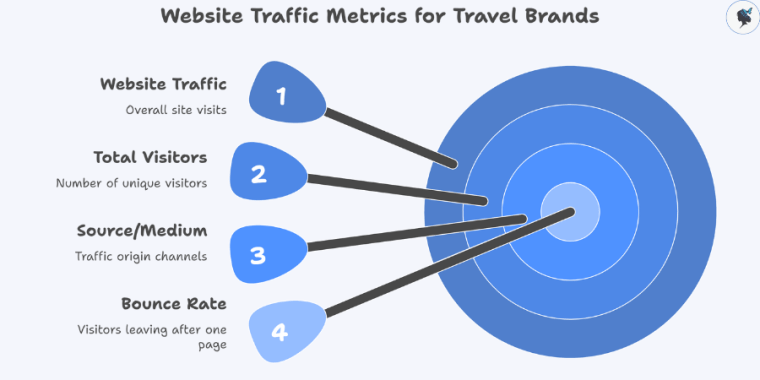
- Total Visitors: This is the number of people visiting your site. Monitoring growth here helps gauge the effectiveness of your awareness campaigns. For example, a spike in visitors after launching a new Instagram campaign indicates successful cross-channel promotion.
- Source/Medium: Understand where your traffic comes from—organic search, paid ads, social media, or referrals. This insight helps allocate budget effectively. If most visitors come from organic search, investing in SEO makes sense.
- Bounce Rate: The percentage of visitors who leave after viewing only one page. A high bounce rate may suggest your landing pages need improvement or your audience targeting is off.
Wander Women Hot Tip: Use Google Analytics to segment traffic sources and identify your most valuable channels. Aim to reduce bounce rates by improving page load speed and creating compelling content.
Conversion Metrics
Conversions show how well your website turns visitors into customers or leads.
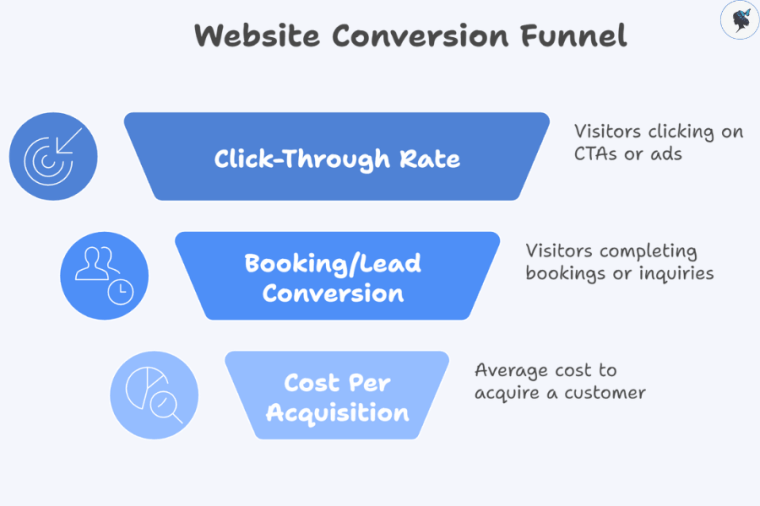
- Booking/Lead Conversion Rate: Track the percentage of visitors who complete bookings or submit inquiries. Improving this metric directly impacts revenue.
- Click-Through Rate (CTR): Measures how often users click on your calls-to-action (CTAs) or ads. For example, a low CTR on a “Book Now” button might signal unclear messaging or poor placement.
- Cost Per Acquisition (CPA): The average amount spent to gain a paying customer. Knowing your CPA helps optimize ad spend and marketing ROI.
Wander Women Hot Tip: Use conversion tracking tools like Google Ads Conversion Tracking or Facebook Pixel to monitor and optimize user journeys.
SEO Performance Metrics
SEO is crucial for attracting organic traffic, especially for travel brands targeting specific destinations or experiences.
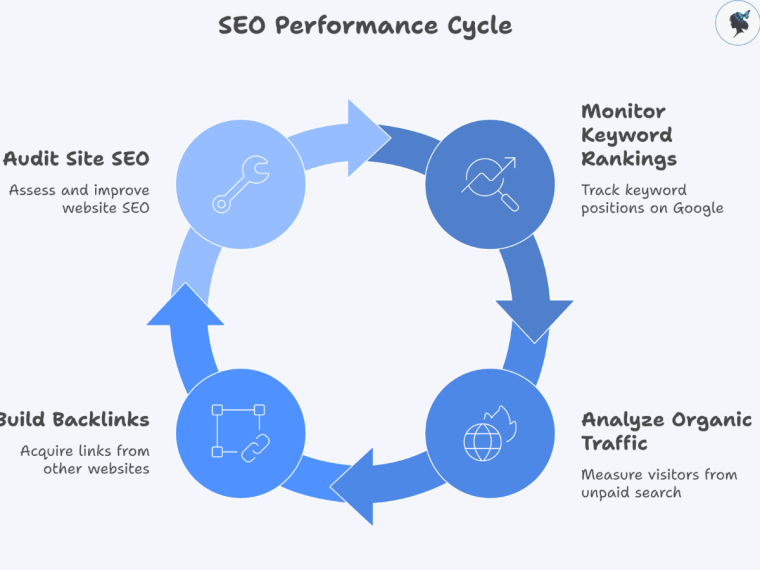
- Keyword Rankings: Monitor how well your targeted keywords rank on Google. Tools like Semrush or Ahrefs can track changes over time.
- Organic Traffic: The number of visitors arriving through unpaid search results. Growth here indicates successful SEO strategies.
- Backlinks: Quantity and quality of other websites linking to your site affect your search ranking and credibility.
Wander Women Hot Tip: Regularly audit your site’s SEO health and build backlinks through guest posts, partnerships, and high-quality content.
Social Media Metrics
Social media drives engagement and brand loyalty in travel marketing.
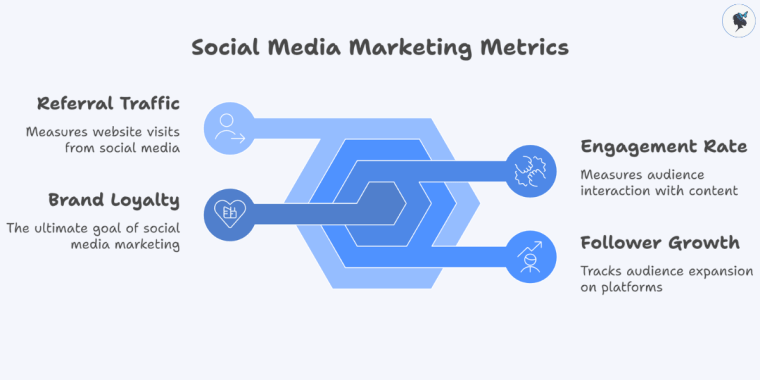
- Engagement Rate: This includes likes, comments, and shares relative to your follower count. High engagement signals resonant content.
- Follower Growth: Track how fast your audience grows on platforms like Instagram, Facebook, or TikTok.
- Referral Traffic: Measure how many visitors come to your site from social media posts.
Wander Women Hot Tip: Use native platform analytics (e.g., Instagram Insights) and tools like Sprout Social to analyze engagement and adjust your content strategy accordingly.
You might like: TikTok travel trends this year.
Email Marketing Metrics
Email remains a powerful channel for nurturing leads and driving repeat bookings.
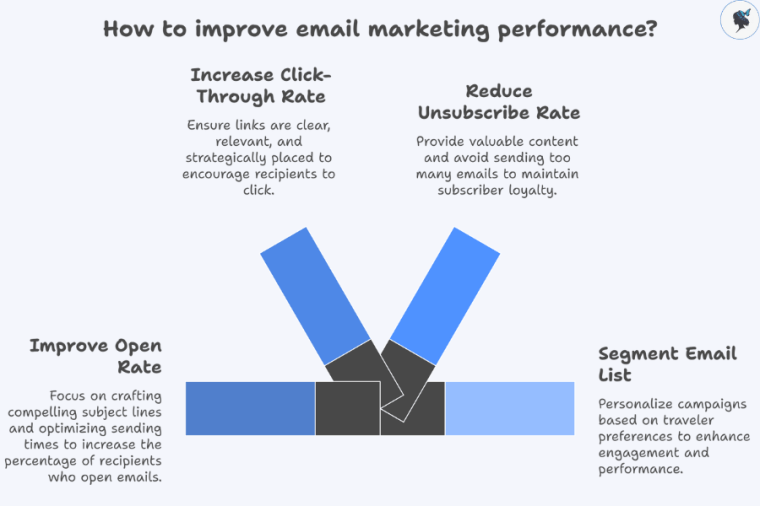
- Open Rate: Percentage of recipients who open your emails. Low rates may indicate ineffective subject lines or timing.
- Click-Through Rate: Measures how many recipients click links within your emails.
- Unsubscribe Rate: Indicates how many people opt out; high rates might suggest irrelevant content or too many emails.
Wander Women Hot Tip: Segment your email list based on traveler preferences or behaviors for personalized, high-performing email campaigns.
Customer Satisfaction Metrics
Happy customers are your best marketers.
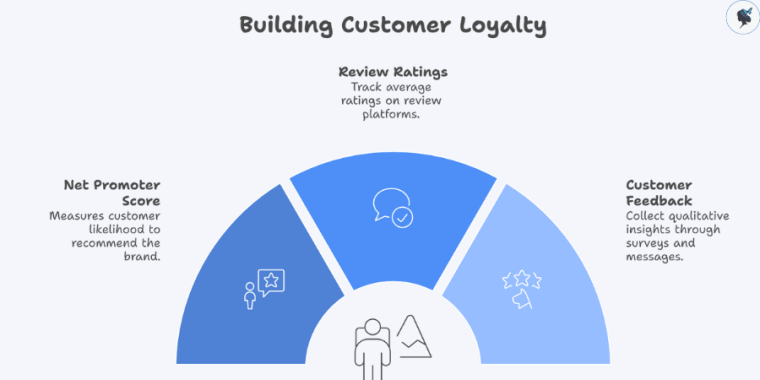
- Net Promoter Score (NPS): Measures likelihood of customers recommending your brand. Scores above 50 are considered excellent.
- Review Ratings: Track average ratings on platforms like TripAdvisor or Google Reviews to monitor brand reputation.
- Customer Feedback: Collect qualitative insights through surveys or direct messages to uncover pain points and opportunities.
Wander Women Hot Tip: Actively respond to reviews and use feedback to improve your services, which boosts loyalty and referrals.
Advertising Metrics
Paid advertising fuels rapid growth but must be carefully managed.
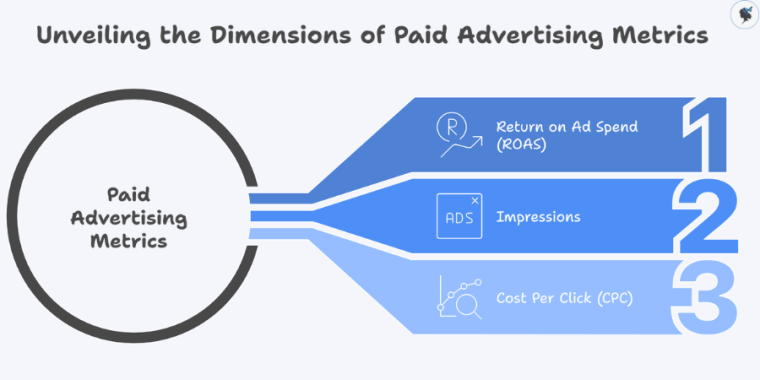
- Return on Ad Spend (ROAS): Revenue generated per dollar spent on ads. A ROAS greater than 4:1 is often targeted in travel campaigns.
- Impressions: How often your ads are shown. Useful for brand awareness metrics.
- Cost Per Click (CPC): Average cost per ad click; lower CPC means more efficient spending.
Wander Women Hot Tip: Continuously test ad creatives and targeting options to maximize ROAS. Use A/B testing for best results.
Conclusion
Tracking these key metrics empowers travel marketers to make informed decisions, optimize campaigns, and grow their brands sustainably. Use the right analytics tools, regularly review your data, and adjust your strategies accordingly to stay competitive in the evolving travel marketplace.
Need help setting up analytics dashboards or interpreting your data? Contact us today!
Discover more from Wander Women Strategies
Subscribe to get the latest posts sent to your email.

One thought on “Top Metrics Travel Marketers Should Track”
Comments are closed.